Data Analysis With Excel
As a finance professional you use Excel to analyse data, but how often do you overlook Excel’s useful features? This course explores some basic and more advanced features of Excel’s PivotTable tool, covering Power Pivot and DAX (Data Analysis Expressions) formulas.
£100 +VAT

Data Analysis With Excel
£100 +VAT
Data Analysis With Excel
This course is not currently available. To find out more, please get in touch.
This course will enable you to
- Create tables, filter, sort and extract data for efficient data analysis
- Set up a PivotTable and apply summaries and calculations
- Create and modify a PivotChart and use the GETPIVOTDATA function
- Analyse data across multiple tables or data sets from different data sources using Data Analysis Expressions (DAX) formulas
About the course
Excel is a go-to tool for finance professionals, but many users only scratch the surface of its data analysis capabilities. Whether it’s filtering tables or summarising results, small inefficiencies can add up, and valuable insights can go unnoticed.
This course helps you get more from Excel by exploring both basic and advanced features for analysing data. You’ll learn how to create tables, apply filters and summaries with PivotTables, build and customise PivotCharts, and extract insights using the GETPIVOTDATA function. The course also introduces Power Pivot and DAX (Data Analysis Expressions), giving you the skills to work with multiple data sets from different sources in a more dynamic way.
By the end of the course, you’ll be equipped to handle data more efficiently and extract meaningful insights – whether you’re working with small spreadsheets or large, multi-source datasets.

Contents
Table, Filter, and Sort features
Preparing to set up a table
Set up your table
Benefits of tables
How to filter data
Sorting and Conditional Formatting
Sort, filter and format
Extracting data
Multiple criteria
Using the FILTER Function
PivotTables: the basics
Understanding PivotTables
How to create a PivotTable
Summarising options
Setting up a PivotTable
Calculating value fields
Showing PivotTable values
Grouping data in a PivotTable
Grouping and ungrouping
Applying a filter
Report filters and slicers
Advanced PivotTables
Calculated fields
Creating a calculated field
Formatting a PivotTable
Formatting options
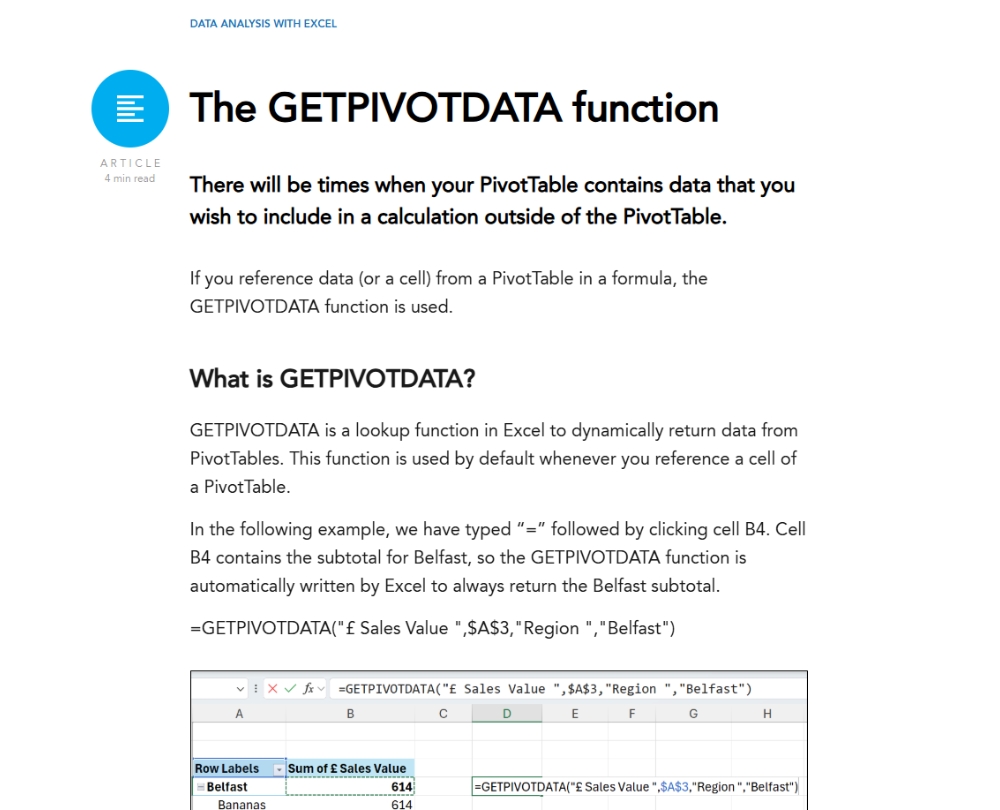
The GETPIVOTDATA function
Slicers and timelines
Adding slicers and timelines
Creating a PivotChart
PivotCharts in action
Power Pivot
Understanding Power Pivot
Adding tables to a data model
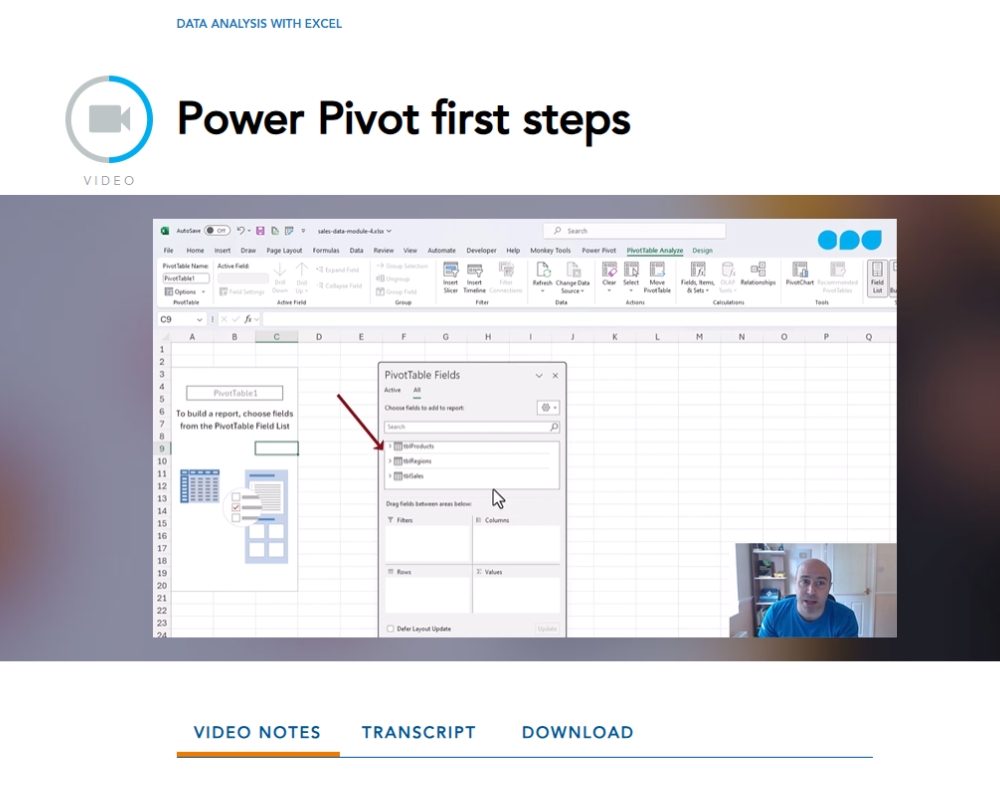
Power Pivot first steps
Table relationships
Connecting tables
DAX formulas in Power Pivot
Creating DAX measures
Data model to PivotTable
An alternative way to pivot
How it works
Author

Alan Murray
Alan has over 20 years” experience as an Excel trainer and loves to help companies improve their business processes and learn how to harness the power of Excel.
You might also like
Take a look at some of our bestselling courses