Making Monthly Reports Worth Reading
World class finance functions produce monthly reports that managers actually read. This course enables you to delight your audience by setting clear objectives, creating compelling visuals and creating monthly reports that drive business improvement.
£100 +VAT

Making Monthly Reports Worth Reading
£100 +VAT
Making Monthly Reports Worth Reading
This course is not currently available. To find out more, please get in touch.
This course will enable you to
- Clearly outline business strategies and relevant KPIs in your monthly reports
- Know what to report on, helping to lay the foundations for effective reports
- Align your business strategy with your reporting
- Cater for different audience needs including understanding the best way to present data
- Design and format monthly reporting dashboards
- Help users interpret your reports
- Use your reports to identify performance issues and provide solutions
About the course
Preparing monthly reports is a task we are all familiar with. But could you be doing more to use these reports to drive business and find the root causes of problems?
To use your monthly reports to inform business strategy, you need to understand who you are reporting to, what they need to know, and how to share that information in the most coherent way.
Setting clear objectives, creating compelling visuals, and identifying and finding solutions for problems ahead of time – this course looks at ways to improve the effectiveness of your reporting. You will look at organisational strategies, KPIs, and presentation methods, as well as learning how to structure and design your analysis, making your reports worth reading every time.
Contents
Deciding what to report
What’s in a report?
Monthly reports matter
Developing a strategy
The importance of context
The hierarchy of KPIs
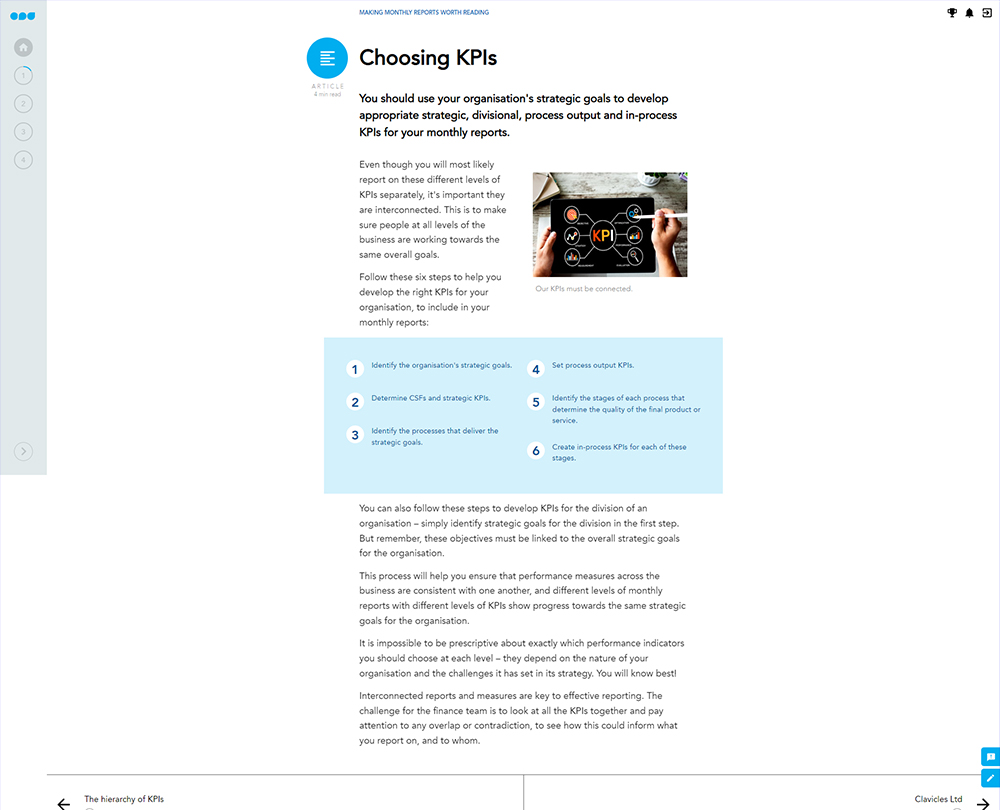
Choosing KPIs
Following best practice
The principles of effective reporting
Reading the room
Your audience
Thinking styles
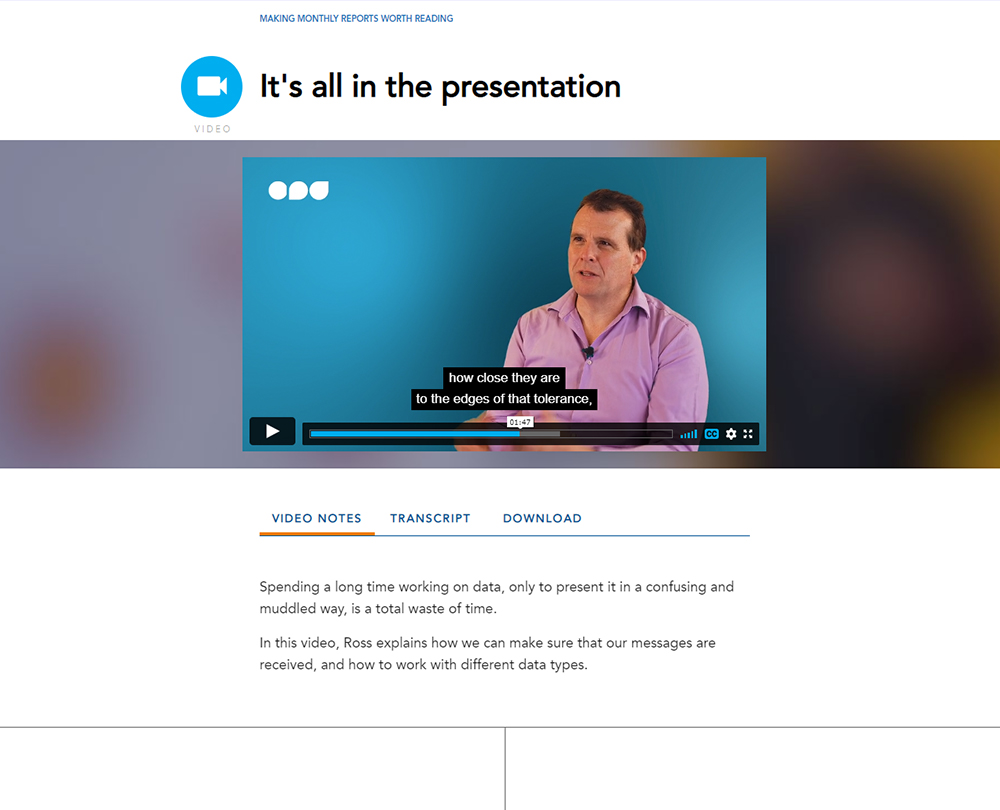
It’s all in the presentation
Bad presentation
Good presentation
Presenting performance and cost
Using dashboards
Getting the tech right
What is a dashboard?
Designing a dashboard
Structuring your dashboard
Additional comments
Commentary
A born presenter
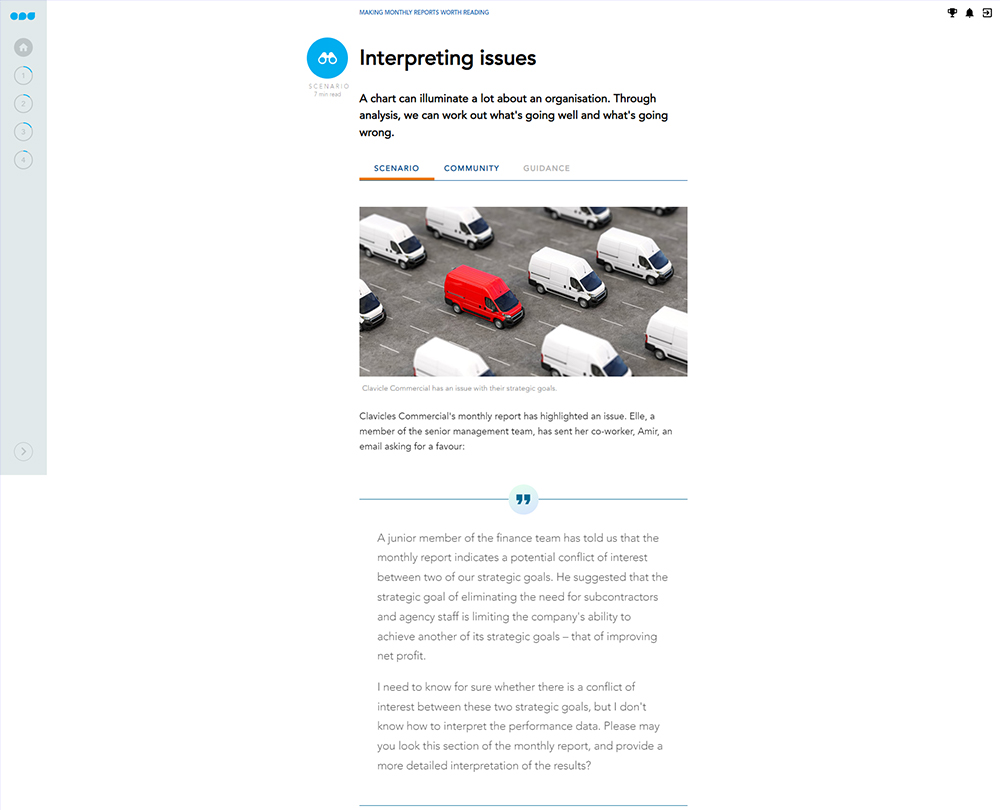
Reacting to the monthly report
Improvement cycles
Root causes
The best solution
Reviewing improvement progress
Receiving feedback
Feedback
Key points
How it works
Author

Ross Maynard
Ross has worked as a consultant and trainer for over 20 years, specialising in finance processes, management information and performance measurement. He supports organisations to understand their processes; facilitates improvement teams; and supports staff to work together as a team to deliver tangible and sustainable improvements.
You might also like
Take a look at some of our bestselling courses