Power Pivot: Getting Started
This course has been designed to take the novice Power Pivot user to a level where they are comfortable working with Power Pivot models and using Pivot tables and charts. You’ll also be able to carry out calculations and time intelligence functions by learning the basics of DAX.
£100 +VAT

Power Pivot: Getting Started
£100 +VAT
Power Pivot: Getting Started
This course is not currently available. To find out more, please get in touch.
This course will enable you to
- Familiarise yourself with the user interface of Power Pivot
- Use different tools to set up relationships in Power Pivot
- Use Power Pivot to quickly insert pivot tables, charts, form multiple tables and analyse data
- Work easily with calculations and data models across multiple tables of data using DAX
- Understand the basics of DAX, including time intelligence functions that aren’t found in Excel
About the course
Power Pivot is an Excel add-in that provides some of the most powerful features for accountants. With its own DAX functions, it can be used to perform multiple calculations and complicated data analysis, enabling you to create sophisticated data models.
This course, goes beyond the basics, to enable you to become more comfortable with Power Pivot Models, using Pivot tables and charts, as well as carrying out calculations and time intelligence functions. It is recommended that you have a good understanding of Excel’s standard pivot tables and charts before taking this course. If you are a beginner with excel, you will find that this course goes well alongside Data Analysis for Accountants: Getting Started.
Note: Power Pivot is not currently available in Excel for Mac.
Contents
Power Pivot orientation
Welcome
Power Pivot
Linked tables
A quick tour
Getting data into Power Pivot
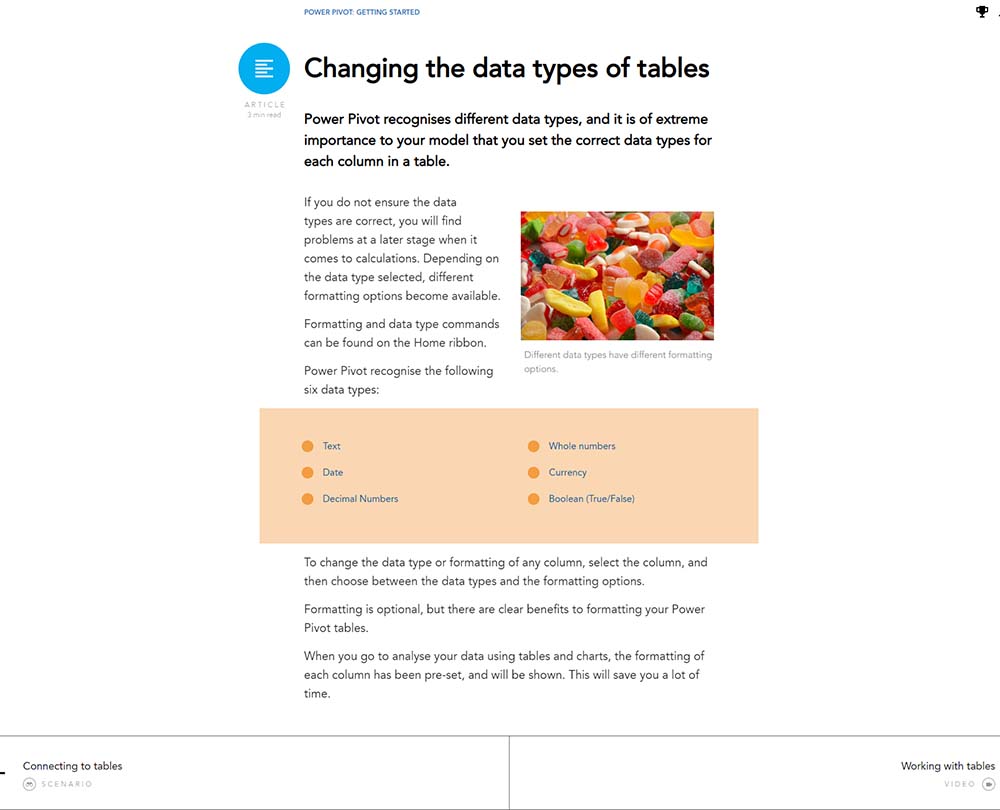
Changing the data types of tables
Working with tables
Relationships
Welcome
Relationships
Fact and dimension tables
Setting up relationships
Many to many relationships
Tables and charts
Welcome
Inserting PivotTables
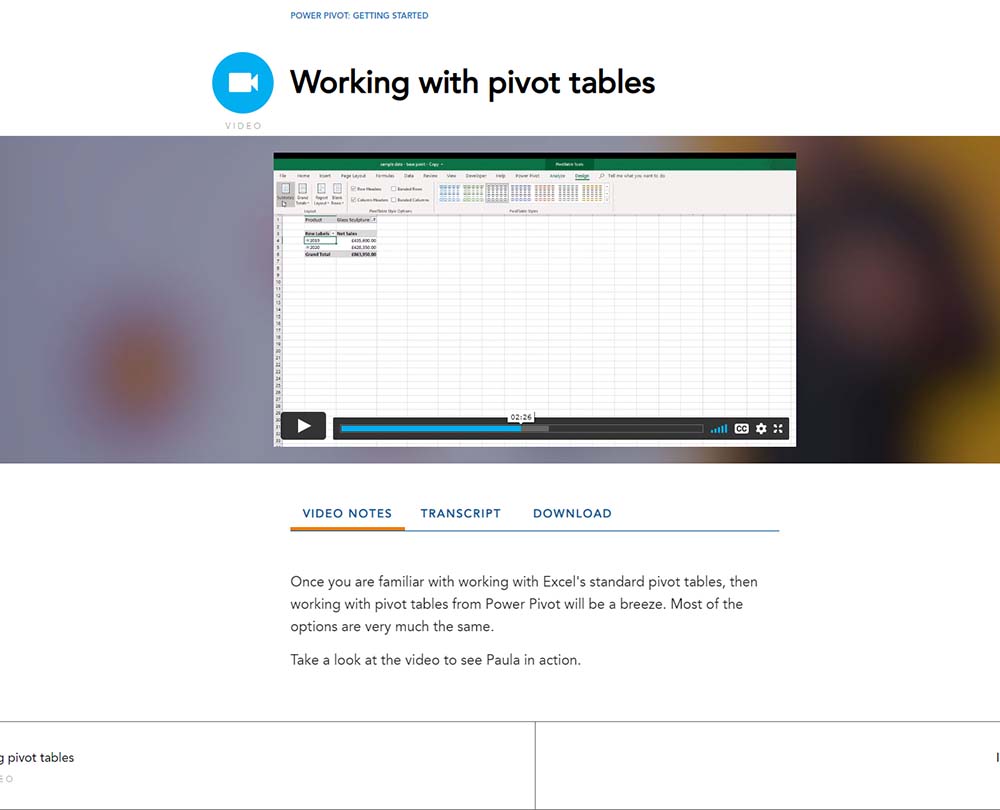
Working with PivotTables
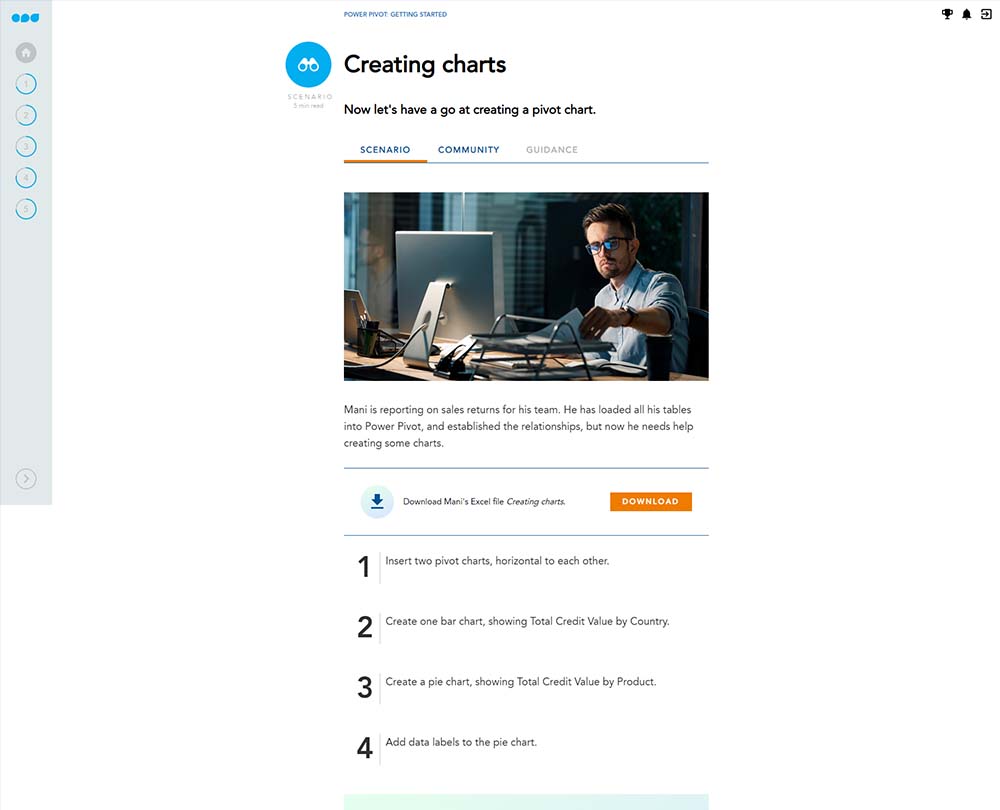
Inserting PivotCharts
Chart Elements
Slicers and timelines
Understanding DAX
Welcome
DAX
Calculated columns and measures
SUM and SUMX
Count functions
COUNT and COUNTX
Working with related tables
Time intelligence functions
Welcome
Time intelligence functions
Date and calendar tables
TOTALMTD, TOTALQTD and TOTALYTD
Comparing to a previous period
Moving and rolling totals
How it works
Author

Paula Guilfoyle
Paula practiced in Industry for over 15 years, working with both small and large private companies, before moving on to teach Excel and Power BI to accountants and professionals.
You might also like
Take a look at some of our bestselling courses